Overview
This is a web application I built for a government agency to manage public aid distribution across multiple regions. Before this system existed, the entire process ran on disconnected spreadsheets and paper forms. Officers had no centralized way to track procurement contracts, inventory levels, or where aid was actually going.
The platform I built gives officers a single place to manage the full lifecycle: procurement, inventory tracking, GPS-verified distribution handovers, and reporting. It also includes a public transparency portal where citizens can view anonymized statistics about the program.
This was one of the more complex projects I’ve worked on, touching role-based access control, real-time map visualization, audit logging, and data integrity constraints at the database level.
Challenge
Government aid distribution programs need accountability at every step. The existing process had none of the infrastructure to support that:
- Procurement and distribution were tracked via disconnected spreadsheets and paper forms. No single source of truth existed
- Compiling a report required hours of manual cross-referencing across multiple files, which meant reports were either delayed or full of errors
- There was no geographic visibility into distribution patterns. Nobody could answer “which regions received aid this month?” without digging through records manually
- Zero audit trail. For a government-funded program, that’s a serious accountability gap
Solution
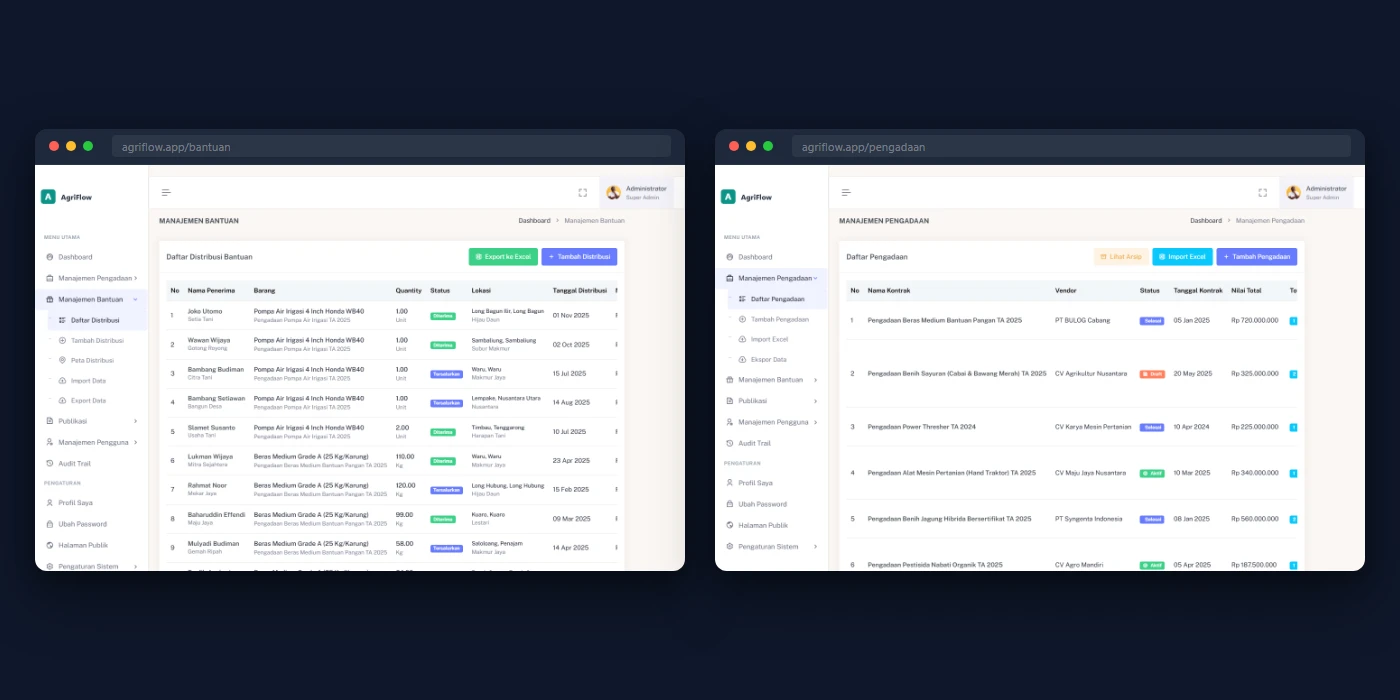
Procurement and Distribution
The core workflow replaces spreadsheets with a structured digital process that enforces data integrity from the start.
- Real-time stock tracking with database-level locking prevents over-distribution. If the inventory says 100 units remain, no officer can distribute 101
- A 3-step distribution wizard captures GPS coordinates at each handover and uses reverse geocoding to record the location automatically
- Bulk Excel import/export with downloadable templates lets officers transition from their existing spreadsheet workflows without friction
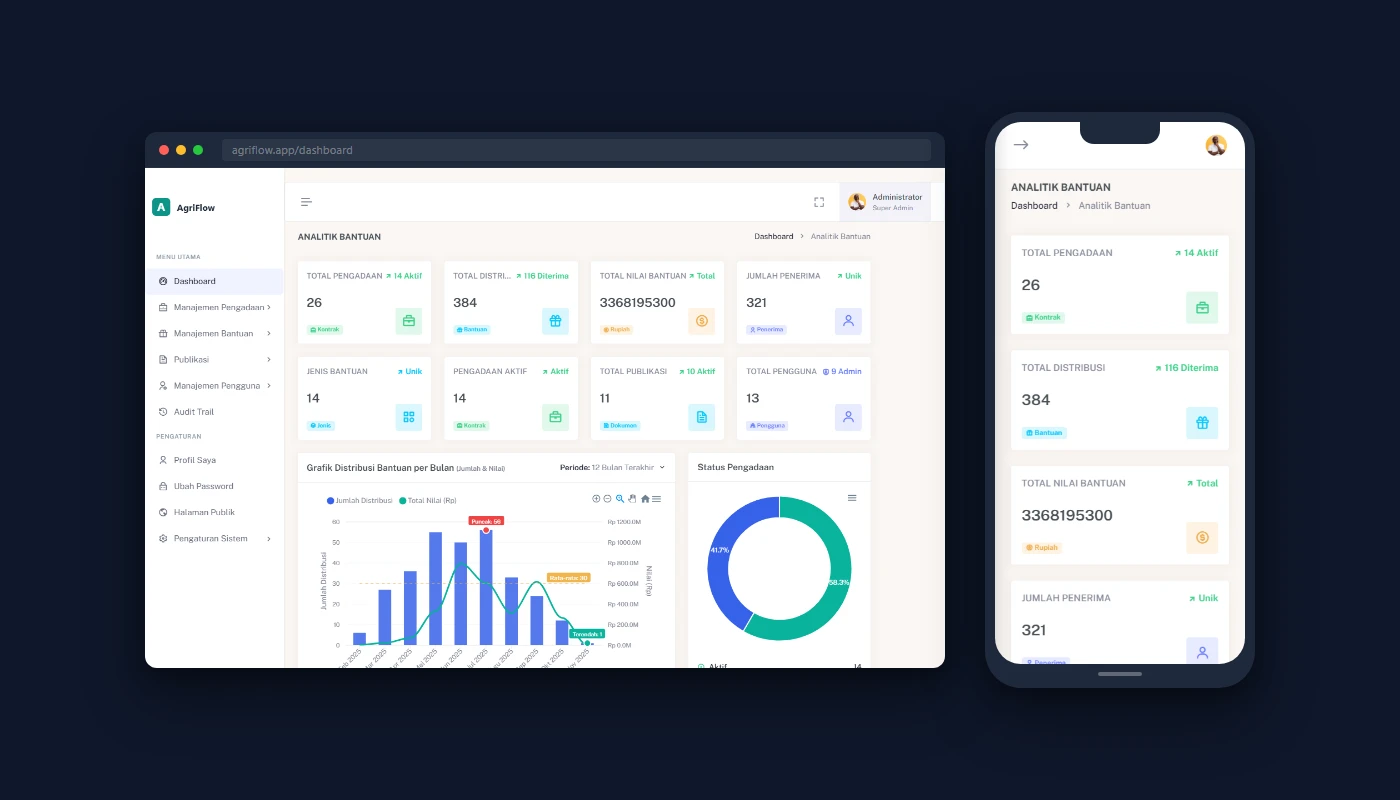
Map and Analytics
Visibility was the biggest gap in the old process. Now everything is on a map.
- Interactive Leaflet.js map with cascading filters and marker clustering shows exactly where aid has been distributed across regions
- Dashboard with KPIs, trend charts, and region-level drill-down gives leadership a real-time picture of program progress
- The public-facing view uses deterministic location masking to preserve recipient privacy while still showing distribution patterns
Security and Transparency
A government platform needs both strict access control and public accountability.
- Role-based access control with 3 roles and 34 granular permissions ensures officers only see and do what their role allows
- Automatic audit trail logs every action with before/after diffs, creating a complete record for accountability reviews
- A public portal with anonymized statistics and publication downloads gives citizens visibility into how the program is performing
Results
- Report generation → Under 5 minutes, down from approximately 3 hours of manual cross-referencing
- Data integrity → Over-distribution completely eliminated through database-level stock locking
- Geographic visibility → Real-time interactive map across all regions, replacing zero geographic insight
- Data entry speed → Approximately 70% faster per distribution record compared to the spreadsheet workflow